How I Built a Dividend Capture Platform in Django
- ikerdomingoperez
- Nov 21, 2025
- 4 min read
Blame my random python scripts
A bit over a month ago I sat down to write a technical post about dividend strategies and data extraction. Just for fun, because I like to do random stuff with python. I was self‑taught on how stocks work and still learning the markets, but one idea kept pulling me in: could you buy a stock before its dividend, collect the payout, and sell after the price recovered to keep the dividend without losing on the trade itself? (now I learned that is actually a thing called Dividend Capture). That simple question turned into a project that became dividendhunting.com, a Dividend Capture platform in Django.
The Spark
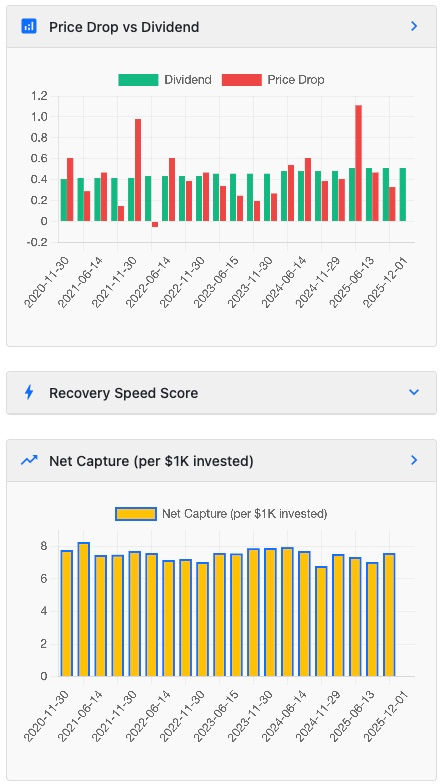
The mechanics are straightforward. Companies set an ex‑dividend date; you must own the share before that date to receive the payment. On the ex‑date the share price typically drops by roughly the dividend amount. If the price recovers, the trade can be profitable purely from the dividend.
While researching I scraped lists from Wikipedia, the S&P 500, Nasdaq, and TradingView, and pulled historical prices from Yahoo Finance. I wrote about the pipeline and then paused at two questions that wouldn't leave me:
How fast does the stock recover its price, if at all
How anxious will I get if the stock doesn't recover as quickly as I expect
Those questions revealed a gap. Existing tools show upcoming dividends and yields, but they rarely show recovery patterns or something that tells you quickly how good or bad is each opportunity.
Also I found another question that may seem trivial, but it turned out not straight forward:
How to get a unified source of truth for all the Markets, Exchanges, Stocks, ETFs and their data, around the world?
This was the first problem to solve. After I got the source of truth I did some research and skipped those markets that don't do dividends, like FOREX, Crypto, Futures or Commodities. Basically, just markets with equities. The result, in numbers:

At that moment I realized I wasn't just writing yet another Python random script post, I was building a mental model of what I needed. Each section of that initial post was a piece of a solution that did not exist yet. So I took a step back and started to build the thing instead.

Building the Tool
I stopped at the blog draft and started building. The product logic was clear:
Find stocks that match your criteria: upcoming dividends, available on your market, and within your risk tolerance.
Show the data that matters: ex‑dividend date, yield, historical recovery patterns, capital required, and analyst context.
Answer the hard questions: which stocks recover quickly, which take weeks or months, which never recover.
Do some maths: with all the data in hand, find the metrics and weights required to put a score on each instrument, so you can quickly view their health.
Dividend hunting is not for everyone. It requires discipline, speed, and the ability to tolerate short‑term losses. But for those willing to try, a dashboard that consolidates the right metrics saves hours of manual research and can give a very nice return each month.

Spoiler alert, when done right (and when the Stock Market Gods are by your side), the cadence of a Dividend Hunting strategy goes in 2-3 days cycles. The stocks that you want to buy are not the ones with the highest dividend, but those with the perfect balance between super fast recovery, instrument health and yield amount. This means each rolling month you can repeat the strategy 8 to 10 times.
The returns will vary of course, some months you may double your capital, other months Trump may open his big mouth and you are left stranded with a stock that refuses to recover. But in any case, thanks to this tool you can easily filter out, study, view some nice metrics and charts until you find what fit best for you.

What DividendHunting.com Does
Dividendhunting.com is a freemium platform built to surface dividend opportunities across thousands of stocks. Key features:
Stocks and ETFs across the world. Symbols extracted from all known Markets & Exchanges.
Two‑week opportunity window showing stocks with upcoming dividends.
Recovery patterns derived from past dividend events for each stock.
Sortable metrics: yield, potential gain, recovery days, propietary scores and more.
Free tier that shows public info you can find anywhere, plus a nice dividend calendar, which is not that easy to find. No commitment. This is something actually big, you won't find many tools around with a nice interactive, clear and free way to just get a flat list of all instruments.
Paid tier with full access: advanced filters by premium fields (scores, recovery days, expected earnings), historical recovery charts, exports, watchlists (coming soon), and email alerts when new matches appear.

The platform is designed to inform, not to decide for you. It gives the data you need to make your own trade decisions.
How to Use It
Start with the free tier to see today's opportunities and understand the workflow.
Study charts and use filters to prioritize opportunities that match your strategy.
Use historical recovery patterns to set realistic expectations and manage anxiety when a position is temporarily underwater.

Closing Thoughts
I'm still learning and still collecting data. The original technical post about scraping and the pipeline will be finished and published. For now, I built the tool I wished I had when I started, and I wanted to share it with others who might find it useful.
The backend is 100% Python, based in Django, with some nice custom HTML for a better user experience. On the following days I will also share more insights about Django best practices and tips to customize everything that can be customized in any shape or form (which I tell you know, is everything).
If you're curious about dividend hunting and want to avoid hours in spreadsheets or jumping from one website to another, try dividendhunting.com. Take a look at the FAQ, Sign up and start exploring for free.


Comments